Forecasting 500 store-item sales series with six models
We fit six forecasting models to each of the 500 store-item series in a Kaggle retail dataset. Prophet had the lowest daily error, and predicting the best model for each day didn't beat Prophet alone.
Nobody can hand-tune a forecasting model for each of thousands of products. So which models hold up across hundreds of sales series when they have to be fast, need little or no tuning, and be simple enough to explain? And can you predict which one will be closest on a given day?
I worked on this with four collaborators. They covered the problem framing and Kaggle rules, exploratory analysis, evaluation metrics, and conclusions. My part was the models: the pipeline that fit every forecasting method to every series, and the forecasts the rest of the project was built on. The code is on GitHub at despresj/Data-Mining-Proj.
The data and the metric
The data came from Kaggle’s Store Item Demand Forecasting Challenge (2018): daily unit sales for 50 items at 10 stores, January 2013 through December 2017. That’s 500 store-item series and 913,000 rows. The challenge asks for the next 90 days of every series, 45,000 predictions, scored with symmetric mean absolute percentage error (SMAPE). SMAPE divides each error by the average of the forecast and the actual, so a series that sells 20 a day counts as much as one that sells 150.
The data were very clean; the one day with zero sales was set to 1 so SMAPE stays defined. To compare models, we cut every series at July 2, 2016: 1,279 days for training and the remaining 547 for testing, a 70/30 split.
Six models, fit 500 times each
I picked three classical models and three newer ones, and fit each separately to every series.
Exponential smoothing (Holt-Winters) had an additive trend, an additive 365-day season, and a Box-Cox transform, and took about 15 minutes for all 500 series. The seasonal autoregression was statsmodels AutoReg with 5 lags and 365-day seasonal terms, about a minute and a half for all 500, with each series fit on its own. ARDL was statsmodels ARDL with 365 lags and a linear trend. With no outside regressors and no seasonal dummies switched on, that’s really a long autoregression reaching back a full year.
XGBoost fit 1,000 boosted trees per series on calendar features: day of week, month, day of year, week of year, year, and a running day count. Prophet is Facebook’s additive model of trend plus yearly and weekly seasonality, run with near-default settings. NeuralProphet is a PyTorch rebuild of Prophet that can add autoregressive terms. We ran it with defaults, which leave those off.
Results on the test period
Daily SMAPE had a clear winner. Prophet scored 12.89, ARDL 16.83, NeuralProphet 18.44, exponential smoothing 19.31, the seasonal autoregression 23.93, and XGBoost 30.35.
Tree models can’t extrapolate a trend beyond the range they were trained on. The calendar features, including the running day count, didn’t carry the sales level forward into the test period, so XGBoost under-forecast: its average daily forecast over the test period was 44.78 units against an actual average of 58.83.
Stakeholders usually care more about weekly or monthly totals than a single day, so we also summed forecasts and actuals by week and by month and scored those.
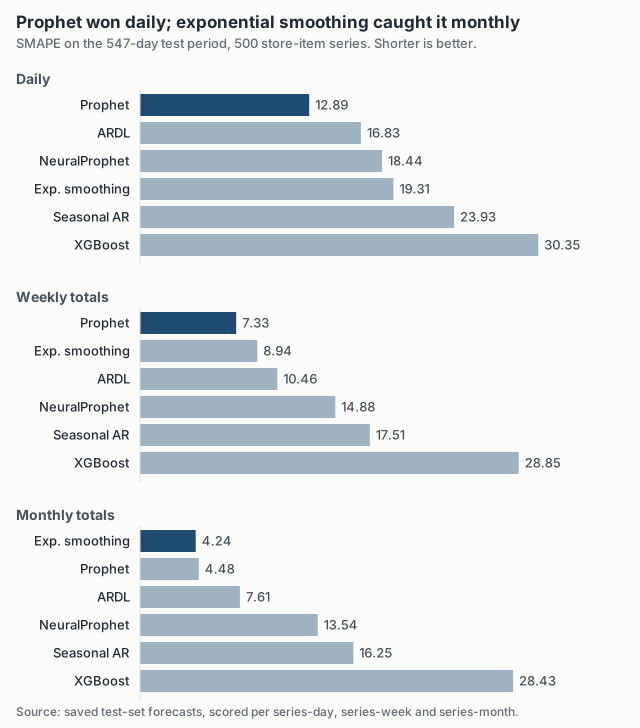
Exponential smoothing was fourth on daily error, but second on weekly totals and first on monthly totals, 4.24 to Prophet’s 4.48. Holt-Winters with only a 365-day season can’t represent the day-of-week pattern, which costs it every day, but those swings cancel out over a month.
We also looked at the spread of daily errors, since an average can hide a forecast that runs consistently high or low:
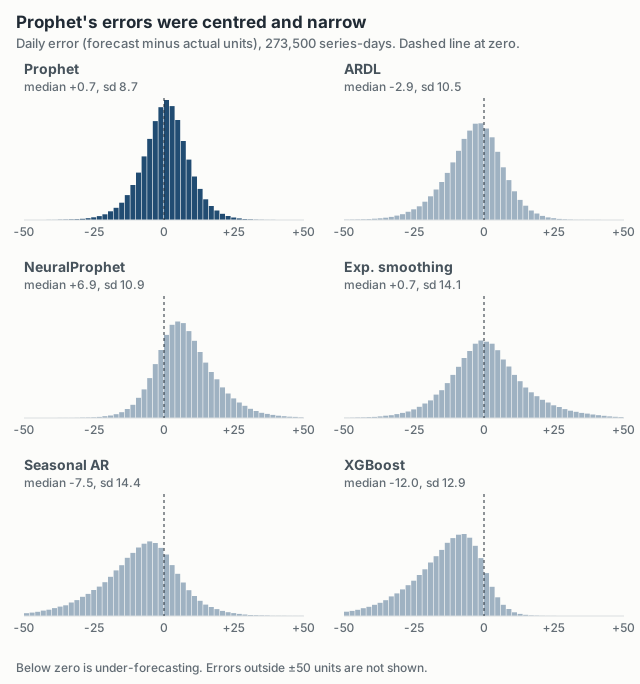
Prophet was centred and the least spread out. NeuralProphet ran high; XGBoost and the seasonal autoregression ran low.
Picking the best model each day
The central question was whether we could predict which model would be most accurate for a given series and day, and use that to combine them. We computed 26 features per series with the tsfeatures package (trend, spikiness, entropy, autocorrelations), added 8 calendar features, and labeled every test-period series-day with the model that came closest.
That’s a hard six-way problem. Prophet was closest on 22.5% of series-days, NeuralProphet on 21.6%, and even XGBoost on 10.8%. The classifiers barely beat always guessing Prophet: logistic regression was right 26.5% of the time, k-nearest neighbours 27.4%, and an XGBoost classifier 28.9%.
We submitted three versions to Kaggle, which scores entries on the hidden 2018 data:
| Submission | Kaggle SMAPE |
|---|---|
| Probability-weighted average of all six | 20.74 |
| Prophet alone | 14.10 |
| Best of ARDL, Prophet, NeuralProphet per day | 14.58 |
The weighted average did worse than four of the six single models had on our test period. Our best guess was that averaging smoothed out the daily swings SMAPE punishes you for missing, and it also gave some weight to XGBoost’s low forecasts. Picking one of the top three per day did better but still lost to Prophet alone. Prophet’s 14.10 on Kaggle was more than a point worse than its 12.89 on our test period.