Meeting lengths in three years of Michigan small business counseling records
What Michigan Small Business Development Center counseling records from fiscal years 2016 through 2018 show about meeting lengths, from where consultant time went to differences by weekday and by client and consultant sex.
Michigan’s Small Business Development Center (SBDC) gives free consulting to small businesses around the state. It shared its counseling records for fiscal years 2016 through 2018 with the three of us on the project: who met with whom, for how long, by what method, and some basic facts about each client’s business.
The organization didn’t give us a hypothesis to test. It wanted to know what the records could say. We settled on four questions:
- What kinds of businesses does the SBDC serve, and which ones take the most time?
- How do consultants spend their time?
- Does the day of the week affect how long meetings run?
- Do meeting lengths differ by the sex of the client and the consultant?
We did everything in R (tidyverse for the data work, estimatr for regressions with robust standard errors) and wrote the report as a Tufte-style R Markdown document. The raw records aren’t public, so everything below comes from aggregates and model output that were already in the final report.
The data came in rounded
The records have two duration fields. tothrs includes preparation and travel. contact covers only time with the client. We used both.
Early on we noticed that durations were rounded. In the cleaned counseling file, 74% of nonzero contact times are exact multiples of 15 minutes. The most common value is 15 minutes, and the second most common is 6 minutes, which is a tenth of an hour. We went ahead on the assumption that rounding up and rounding down roughly cancel out on average. That assumption is reasonable, but we couldn’t test it. Every number below is built on consultants’ recorded estimates of their time.
Where the hours went
Industry was the first cut. Businesses that deal mostly in information had the longest meetings on average:
| Industry | Avg. hours incl. prep and travel | Avg. contact hours | Records |
|---|---|---|---|
| Utilities | 1.95 | 0.99 | 116 |
| Information | 1.65 | 0.87 | 2,037 |
| Finance and Insurance | 1.43 | 0.70 | 380 |
| Professional, Scientific, Technical | 1.39 | 0.69 | 6,042 |
| Wholesale Trade | 1.08 | 0.56 | 2,128 |
| Administrative and Support | 1.03 | 0.56 | 938 |
| Mining | 1.03 | 0.71 | 62 |
The pattern is weaker than it first looks. Once you drop preparation and travel, most industries fall between 0.55 and 0.71 hours. Mining moves near the top, and Public Administration goes from 1.38 hours to last place at 0.53. Much of the gap between industries seems to come from preparation and travel. Several of the averages were also identical, which is what heavy rounding would produce.
The method of communication turned out to matter more:
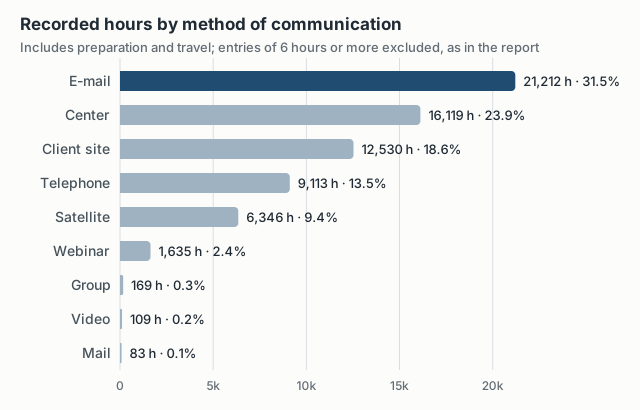
E-mail took the most recorded time, more than meetings at the center or at client sites. E-mail made up about half of all contacts (30,893) and averaged 0.69 hours each, which adds up to almost a third of the hours. Visits to a client’s site were the longest individual meetings, averaging 2.09 hours.
The SBDC headquarters logged more hours than any other location: 23,982 hours across 14,124 records. That was about 32% of the total, the largest single share.
Days of the week
We regressed total hours on the number of full-time employees, whether the business was home-based or online, the client’s sex, and day-of-week indicators, with Wednesday as the baseline.
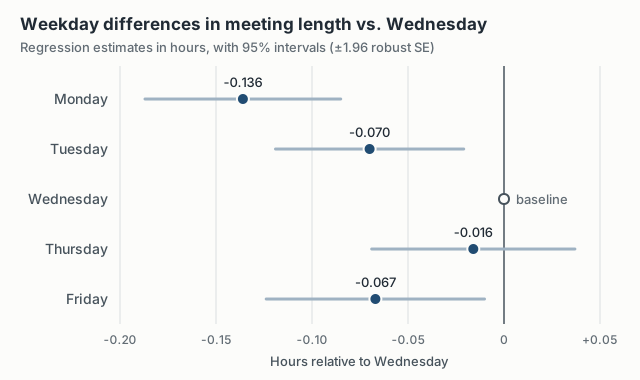
Monday, Tuesday and Friday meetings were shorter than Wednesday’s, holding the other variables constant. Thursday couldn’t be distinguished from Wednesday (estimate −0.016, robust SE 0.027). The day indicators were jointly significant (F = 5.40). Monday had the largest gap, about eight minutes shorter. That’s statistically clear but small in practical terms. The model using contact time only told the same story: Monday −0.093 and Friday −0.046 hours, with Thursday essentially zero.
We also added Census data. We took median household income for each county from the 2018 American Community Survey and averaged it within each of the SBDC’s 11 regions, weighted by population. The regional estimates ran from about $43,100 in the Mid region to $65,100 in Greater Washtenaw. Income’s coefficient in the meeting-length model was 0.0139 (SE 0.0060). That model used the log of hours as the outcome, so the coefficient works out to roughly a 1.4% change in meeting length per $1,000 of income. The standard errors were clustered on just 11 regional groups, which is too few to rely on. We concluded there wasn’t enough evidence that regional income matters.
Client and consultant sex
The records include the client’s sex but not the consultant’s. We inferred consultant sex from usernames, did a quick search when a username was ambiguous, and dropped cases we couldn’t resolve. That’s a rough measurement. Some consultants may have been misclassified, and it’s the first caveat on this section.
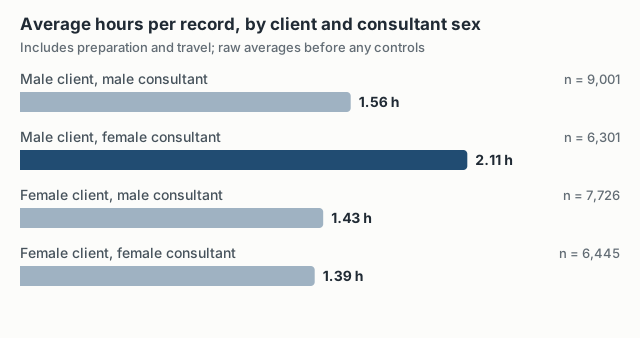
One pairing stands out in the raw averages: male clients working with female consultants, at 2.11 hours versus 1.56 for male-male pairs. In a regression with male-male as the baseline, controlling for employees and home-based and online status, that pairing ran 0.633 hours longer (robust SE 0.056). With indicators for each industry added, the difference was 0.448 hours (SE 0.055), still roughly 27 minutes. Using contact time only, it dropped to 0.067 hours (SE 0.021). So most of the gap is in preparation and travel.
This is an association in one organization’s records. We didn’t have data on which consultants take which kinds of cases, how complex a client’s needs were, or whether some consultants log preparation time more thoroughly than others. Any of those could produce this pattern without the pairing itself mattering. This was exploratory work from a student project, and it doesn’t support conclusions about cause or about fairness.
Takeaways
The clearest results were the simple ones. E-mail was the largest use of consultant time, and client-site visits were the longest individual meetings. The weekday differences were statistically clear but small. And because durations were recorded in rounded blocks, any fine-grained comparison of meeting length deserves caution.