Does a graduate degree close the wage gap between college majors?
Log-wage regressions on American Community Survey microdata compare ten college majors at the bachelor's, master's, and doctorate levels. The ranking of majors barely changes from one level to the next.
Does your major change what you earn, and does that difference hold at the master’s and doctorate level? Take an economics major and an elementary education major who are both considering graduate school in their field. Is the wage gap between them the same after a doctorate as after a bachelor’s? A collaborator and I compared ten majors at all three levels using Census microdata.
Every result below is an association. People choose their major and how long to stay in school, and more able or more motivated people may both study longer and earn more. A cross-section can’t separate the two.
Data
We started with the College Scorecard, summarizing its earnings fields in a short R script. Its earnings are reported per institution, so they couldn’t compare majors within a degree level. We switched to American Community Survey microdata from IPUMS USA. It records each person’s highest degree, first listed field of degree, age, sex, and annual wage and salary income.
For each degree level we kept people 22 or older whose highest degree was a bachelor’s, master’s, or doctorate, who reported positive wage income, and who worked at least 48 weeks the previous year. Professional degrees such as law and medicine have their own code and aren’t included.
| Bachelor’s | Master’s | Doctorate | |
|---|---|---|---|
| People | 1,580,972 | 683,413 | 119,884 |
| Median wage | $57,193 | $71,550 | $94,699 |
| Mean wage | $75,351 | $91,899 | $119,182 |
These pool several years of ACS samples without adjusting for inflation or survey year, and they don’t use the survey’s person weights. The top wage in all three samples is the same $736,000, which looks like the survey’s top code, so the upper tail is compressed.
The model
We ran one regression per degree level. The outcome is the log of annual wage. The controls are a female indicator, potential experience (age minus 22, 24, or 26, depending on the degree), its square, and female-by-experience terms. Then come indicators for ten majors: economics, finance, computer science, statistics, mathematics, business management and administration, engineering technologies, history, psychology, and elementary education. The standard errors are robust. There are no controls for hours, occupation, industry, or location.
Each major’s coefficient compares it to everyone else at the same degree level whose first major was something else, a mix of every other field in the data, so every estimate depends on what else happens to be in that mix. A coefficient b becomes a percent difference as (e^b − 1) × 100. The gaps are big enough that reading log points directly as percentages would be noticeably off: 0.512 log points is 67%, not 51%.
The major indicators are jointly significant at every level. F-tests of the models with and without them give about 367 for bachelor’s, 176 for master’s, and 19 for doctorates, and all three p-values are effectively zero. They also explain very little. Adding the ten majors raises R² from 0.145 to 0.147 for bachelor’s, 0.125 to 0.127 for master’s, and 0.081 to 0.082 for doctorates. Which of these ten fields you studied tells you a lot about average wages and almost nothing about any one person’s.
Wage gaps by major
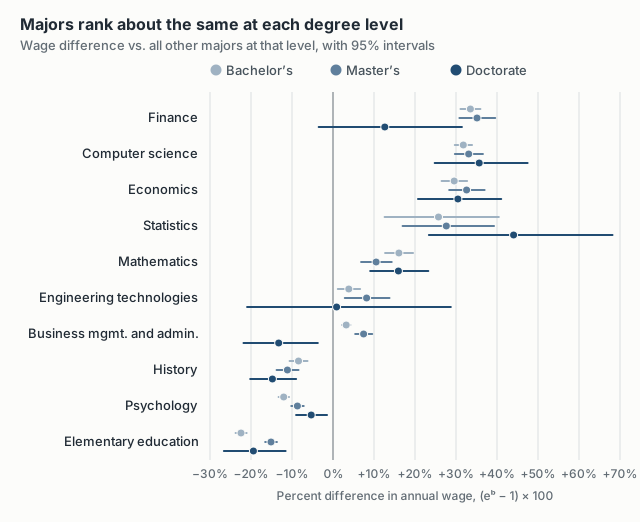
At the bachelor’s level, finance (+33.5%), computer science (+31.8%), economics (+29.6%), and statistics (+25.7%) are well above the comparison group. Mathematics is +16.1%. Elementary education is 22.4% below, psychology 12.0% below, and history 8.4% below.
The order barely changes as you move up a level. Economics is +29.6%, +32.6%, and +30.5% at the bachelor’s, master’s, and doctorate levels. Elementary education is −22.4%, −15.1%, and −19.4%. The doctorate estimates are much noisier because there are far fewer people. Statistics at the doctorate level is +44%, but its interval runs from +23% to +68%. The finance doctorate estimate, +12.6%, has an interval that includes zero.
We tested a few pairs directly, as differences in coefficients at the same degree level. Each cell is the difference in log points with the percent version in parentheses:
| Economics minus | Bachelor’s | Master’s | Doctorate |
|---|---|---|---|
| Elementary education | 0.512 (+67%) | 0.446 (+56%) | 0.483 (+62%) |
| Mathematics | 0.110 (+12%) | 0.181 (+20%) | 0.118 (+13%) |
| Finance | −0.030 (−3%) | −0.019 (−2%) | 0.147 (+16%) |
The economics and elementary education gap is large and very precise at every level (t-statistics of 34.0, 23.9, and 7.8), and roughly the same size at all three. So for the question we started with, graduate school raises wages in both fields, but it doesn’t close the gap between them. Economics over mathematics holds at all three levels too, though the doctorate difference is only significant at 5% (t = 2.35). Economics and finance can’t be told apart at the master’s level (t = −0.82) or the doctorate level (t = 1.66). At the bachelor’s level, finance is about 3% ahead, right at the 5% line (t = −1.97).
An earlier version of the model included usual weekly hours and used a slightly different experience setup. In that version the economics premium at the bachelor’s level was 0.218 instead of 0.259, finance was 0.238 instead of 0.289, and business management and administration was essentially zero. Computer science didn’t move (0.278). Part of some of these gaps goes along with working longer hours.