Will younger workers benefit from population aging?
I regressed individual wages on county age structure for 2009, 2012, and 2017. The 2017 result was negative, and the other two years didn't agree with it.
A common intuition is that retiring baby boomers will leave younger workers in a tight labor market. Fewer workers means firms have to bid for the ones who remain, so wages go up. I spent a summer testing that intuition against recent data.
The setup
I joined three public sources. IPUMS American Community Survey microdata gave me one row per person, with wage, age, sex, race, education, hours, and whether they live in a metro area. FRED county series gave me the median age and unemployment rate for each county. Census county population estimates let me compute the share of each county aged 65 and over.
I kept full-time, year-round workers (at least 48 weeks and 35 hours per week) with a positive reported wage. I ran the same regression separately for 2009, 2012, and 2017. The outcome was log wage. The controls were age and age squared, sex, race, Hispanic ethnicity, education, hours, and metro status. The variables of interest were the county-level age measures.
What came out
The individual age profile looks like every wage study says it should. Earnings rise steeply through the twenties, flatten out in the fifties, and fall after about 60, even after controlling for hours.
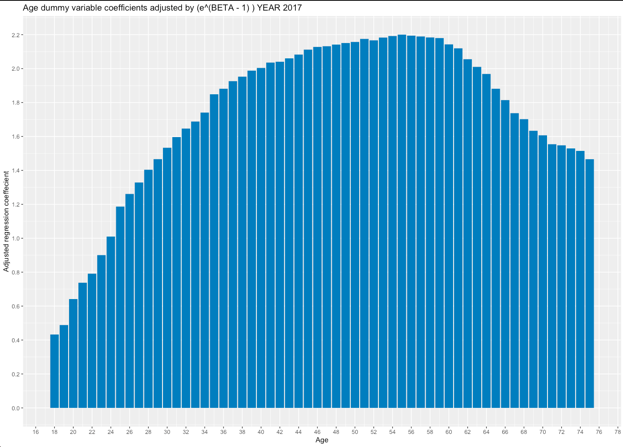
Start with the 2017 county results. A one-point increase in a county’s share of people over 65 was associated with about 5.7% lower wages, holding everything else constant. Median county age entered positively. Adding a squared term made the relationship concave, with a turning point near a median age of 40. The US median was 38 at the time, and the Census projection for 2060 was 43.
I concluded that younger workers probably wouldn’t benefit from an aging population. That conclusion lined up with the literature I’d reviewed, which links aging to slower GDP growth and less entrepreneurship.
The other two years
The regression tables for all three years tell a messier story. Here is the coefficient on “percentage of county over 65” for each year:
| Year | Coefficient | Observations |
|---|---|---|
| 2009 | −0.038 | 259,692 |
| 2012 | +0.022 | 263,642 |
| 2017 | −0.057 | 65,251 |
The sign flips in 2012, and the median-age coefficient bounces around the same way. Each estimate is precise on its own, but they don’t agree with each other, which makes the precision itself something to be suspicious of.
The next steps I’d take start with the standard errors. With county-level regressors and person-level outcomes, they should be clustered on county, which would widen every interval considerably.
Across all three years, the finding is “negative in two of three years, positive in one,” which is weaker than any single year suggests.
Then there’s sorting, which the paper names but can’t address. Young workers move to high-wage places, and retirees move to cheap ones, so a cross-section can’t tell aging apart from migration. A panel with county fixed effects, or an instrument based on the age structure from decades earlier, would at least start to separate them.