What a small online shop's orders said about its customers
Top products, repeat customers, coupon use, and a market-basket analysis in R for a small Etsy shop's 2021 sales.
What sells, who comes back, whether coupons do anything, and which products get bought together: those were the questions a small Etsy shop’s owner brought me at the end of 2021, along with about eighteen months of order exports, from mid-2020 through December 2021.
I answered them in two R Markdown reports three weeks apart. The first was a broad pass over the data, and the second answered the questions that came back from the first. I’ve left out the shop’s name, product names, customers, and dollar amounts.
Cleaning the exports
The exports came as a few CSV files, with one row per item in an order, and most of the work was making those rows comparable. I stacked the files and converted the column names to snake case. I dropped rows that weren’t really products: grab bags, shipping insurance, private listings, and a few one-off items the owner told me to ignore. The same size was written several different ways depending on when the listing was created, so I normalized the size variation. I stripped “pre-order” prefixes from item names, since otherwise a pre-order and the regular listing counted as two products. When an order’s coupon field held several codes, I kept only the first.
After cleaning there were 220 distinct products and 342 product-and-size combinations.
First pass: where orders went
The first report, on December 1, was descriptive. It mapped 2021 orders by ZIP code, totaled sales by state, listed the top buyers, and broke out international orders. It also had a histogram of order totals around the shop’s free-shipping threshold. There was a small bump in orders just past the threshold, but plenty of orders sat just under it, and the most common orders were small ones well below it. A histogram can’t show whether the threshold caused that bump.
One product stood out
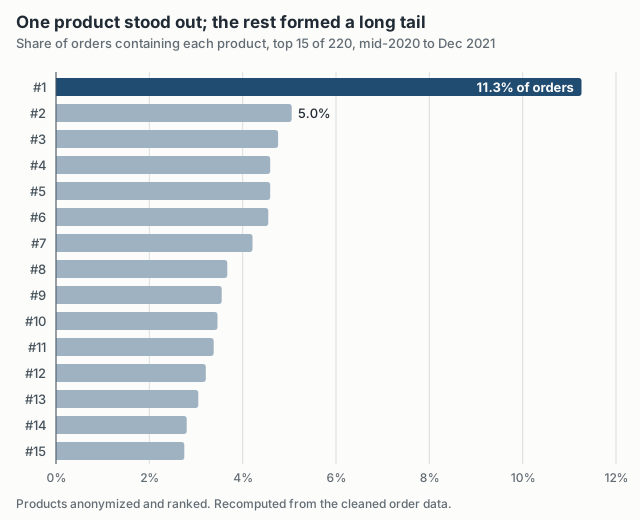
I counted how many orders contained each product. One product appeared in about 11% of all orders, the next most common in about 5%, and after that there was a long, flat tail.
Customers rarely buy duplicates
I checked whether an order ever contained two of the same product. Of the orders with more than one item, 93.4% were all distinct items and only 6.6% had a duplicate. People were building a varied collection and rarely stocking up on a favorite.
About a third of the business came from repeat customers
I marked someone as a repeat customer if the same name and ZIP code showed up on more than one order across 2020 and 2021. For 2021, repeat customers accounted for 34.9% of items sold and 36.8% of sales.
The matching is rough. A customer who moved, or who shipped to a different name, counts as two new customers. Separately, the 2021 split matches on name alone, so two different people with the same name could be merged. And a repeat customer’s first order is counted as repeat business too. I’d treat “about a third” as the finding and hold the decimal places loosely.
Coupons get used when they exist
About 40% of items, in 2021 and across the whole period, were bought with a coupon code. The biggest single code was the 2021 Black Friday sale.
The owner wanted to know how often customers use a coupon when one is available. The data can’t answer that directly, because it records when codes were used and not when they were offered. So I plotted items per week with and without a coupon and looked at the shape.
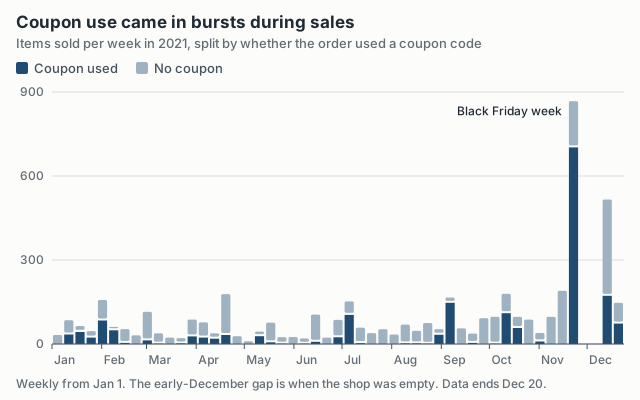
The pattern is bursty. Many weeks have few or no coupon orders, and the spikes line up with sales: in the Black Friday week, about 82% of items were bought with a code. My conclusion was that people generally use a coupon when one is available. I inferred that from the shape of the data; there’s no measured rate behind it.
Products bought together
The last question was which products get bought together. I used the arules package and its Apriori algorithm, limited to pairs of products and a minimum support of 0.003. Each order is a “basket,” and each rule reads “if an order contains A, it also contains B.”
Three numbers describe a rule. Support is the share of all orders that contain both A and B. Confidence is the share of orders containing A that also contain B; it’s a conditional probability, P(B | A), and it depends on direction. Lift is confidence divided by how common B is overall, which works out to P(A and B) / (P(A) · P(B)). A lift of 1 means A tells you nothing about B, and a lift of 20 means an order containing A is 20 times more likely than average to contain B.
Some rules from the report, with products relabeled:
| Rule | Support | Confidence | Lift |
|---|---|---|---|
| B → C | 0.0149 | 0.706 | 27.1 |
| C → B | 0.0149 | 0.571 | 27.1 |
| D → B | 0.0128 | 0.660 | 31.3 |
| E → F | 0.0132 | 0.317 | 7.0 |
| C → best seller | 0.0111 | 0.429 | 3.8 |
| best seller → C | 0.0111 | 0.100 | 3.8 |
The first two rows show how direction matters. The pair has the same support and lift either way, but 71% of orders with B also had C, while only 57% of orders with C also had B. The last two rows show why lift is needed. The best seller appears next to almost everything, so its confidence can look good without meaning much. Only 10% of best-seller orders contained C, and the lift of 3.8 is modest.
The strongest associations were between mid-ranked products. B, C, and D were each in only about 2% of orders, but when one was bought, the others often were too, with lifts from 24 to 31. E and F, two of the most popular products, appeared together in about as many orders as B and C did. Their lift was a lower 7 because each is common on its own. My guess is that the high-lift groups are products shoppers treat as a set. The data shows they sell together, but it can’t say why.
A follow-up: screening ambassador applications
A few months later, in May 2022, the shop opened applications for brand ambassadors and got thousands of them. My script kept the applicants who answered yes to three eligibility questions (18 or older, living in the United States, and willing to post at least twice a week) and dropped repeat submissions from the same email address. Then it scored the free-text answers with the AFINN sentiment lexicon.
The score filtered applications as well as sorting them. Any word the lexicon rates as strongly negative removed an application, and so did a total score of zero or less, or answers with no words the lexicon scores at all. The 3,252 applications left were ranked by score, and each one became a short PDF, in that order.
A positive tone says little about whether someone would make a good ambassador, and one harsh word was enough to drop an application no matter what else it said. The script records which applications made the list and in what order. It doesn’t record how the owner used the list or how ambassadors were chosen.