Thirty charts for a mock FOMC meeting
In a 2019 Fed Challenge, our team played the FOMC and made a rate call. I wrote the R code that built our charts from FRED. We recommended a cut, and the Fed cut a week later.
In a Fed Challenge, a student team plays the Federal Open Market Committee. The team reviews the economy, recommends a policy, and takes questions from judges. Our team had four people, and we presented in late October 2019, a week before the real FOMC meeting. I opened the presentation, covered the labor market, and wrote the R code that built our charts.
The charts
Every chart came from the St. Louis Fed’s FRED database, through the fredr R package. There were about 30 series: GDP and its components, payrolls, unemployment and U-6, prime-age labor force participation, initial claims, PCE and core PCE inflation, producer prices, building permits, capacity utilization, the trade-weighted dollar, consumer sentiment, the yield curve, the prime rate, and the new SOFR repo rate. Each one was a short pipe from fredr_request() to a ggplot2 chart with the same theme, axis breaks, and source caption. They were saved at a fixed aspect ratio so they dropped straight into slides.
The payoff was the week of the presentation. When new data came out, I reran the R Markdown file and every chart was current. Nobody had to redraw anything in a spreadsheet.
What the data said in October 2019
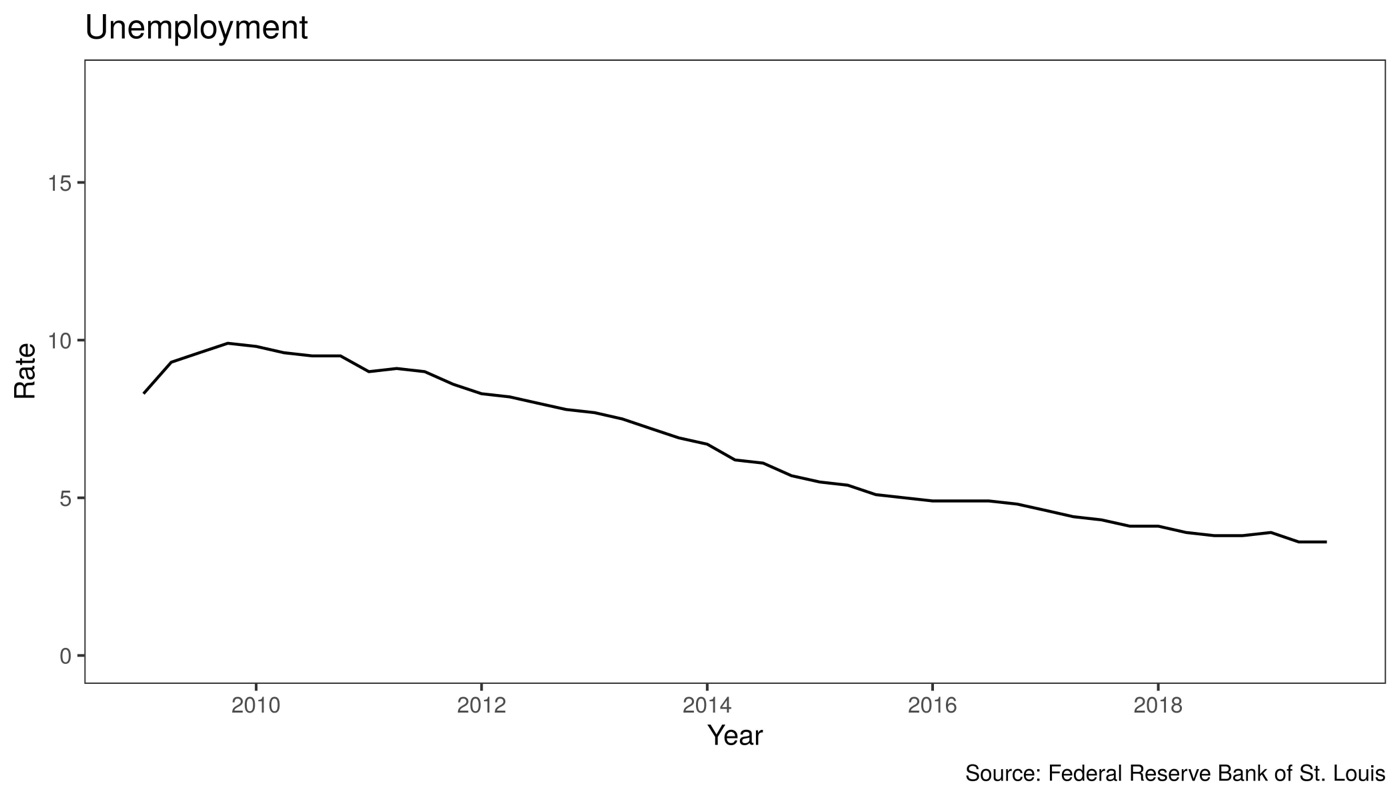
The labor market looked about as good as it gets. Unemployment was 3.5% and U-6 was 6.9%. Initial claims were near decade lows, around 200,000 a week, down from more than 650,000 at the worst of the recession.
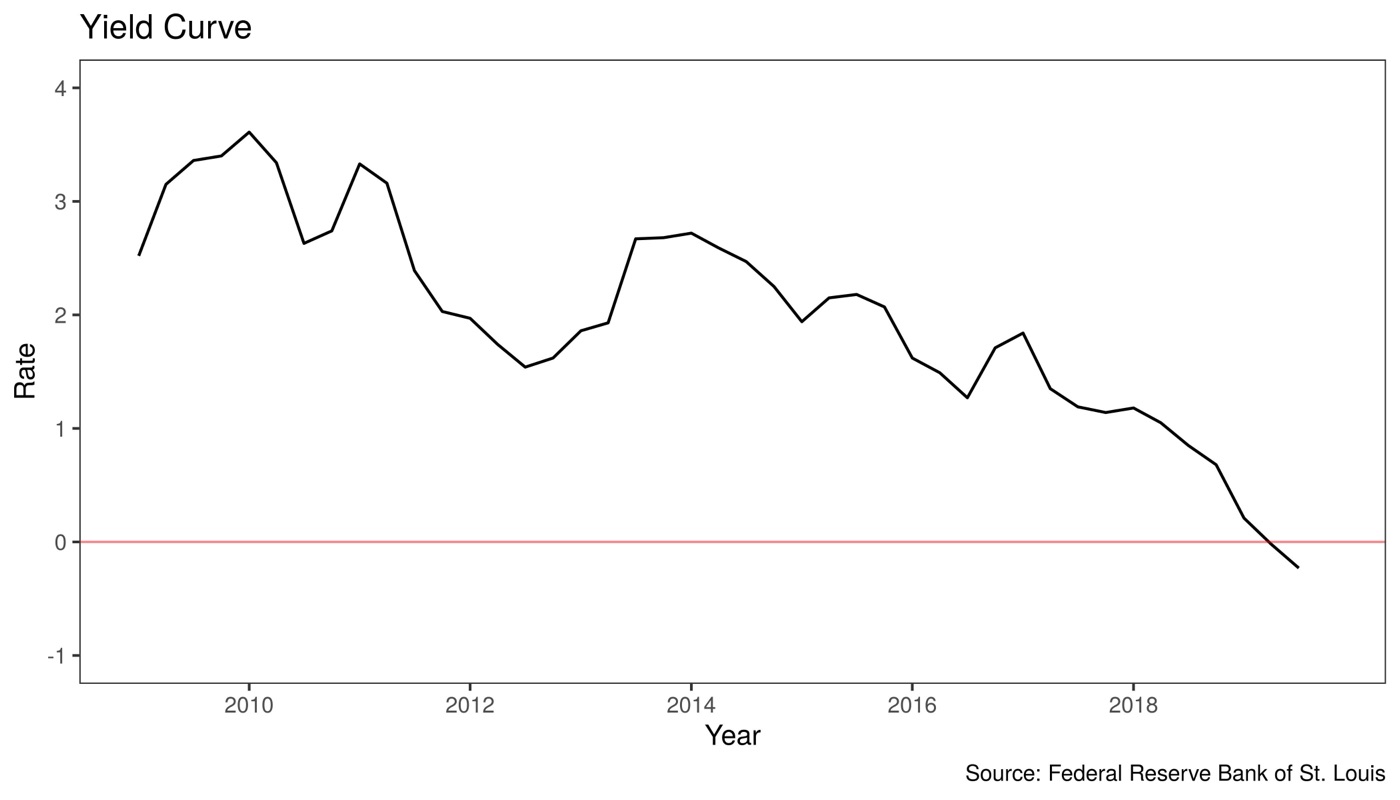
Two charts worried us. The spread between 10-year and 3-month Treasury yields had turned negative in 2019. Historically, that has been a reliable warning of recession.
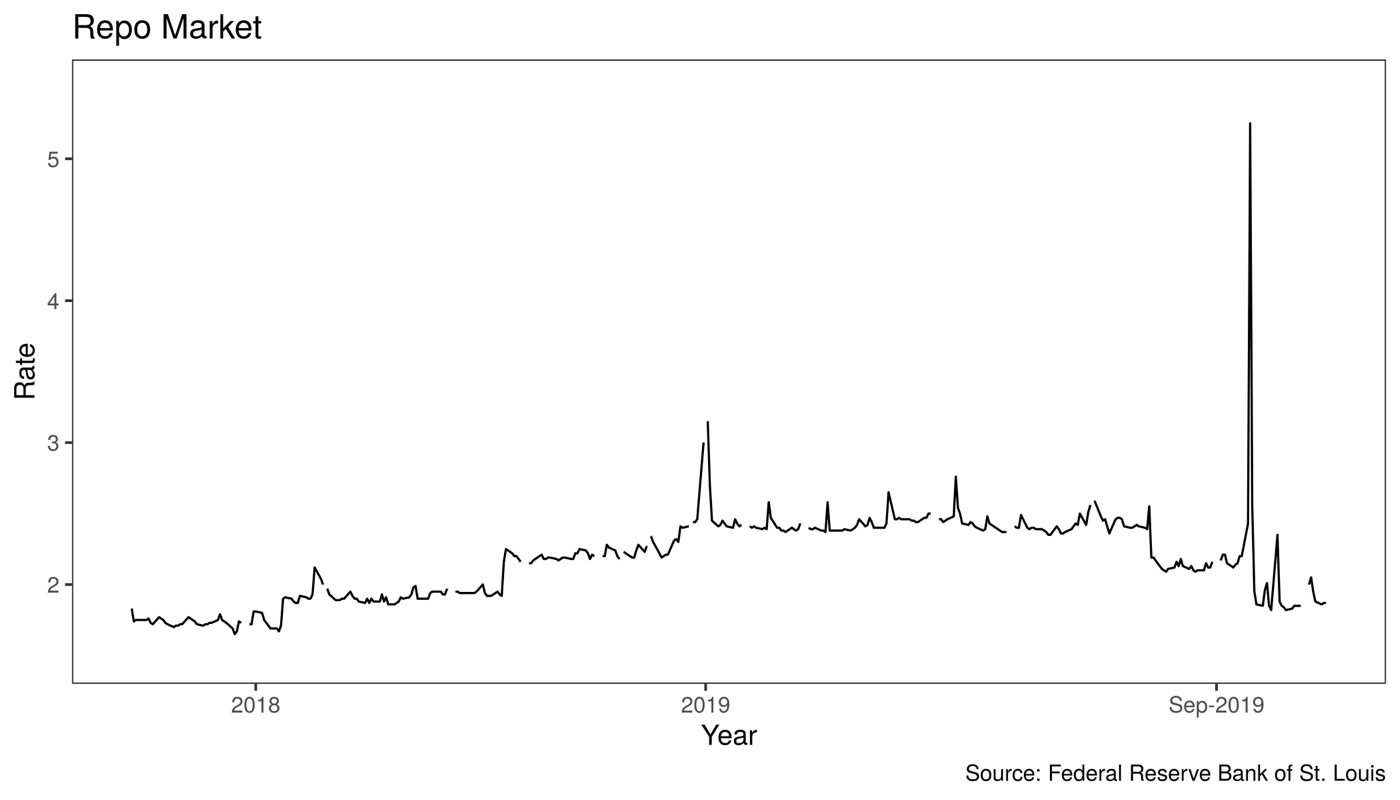
The other was the repo market. In mid-September 2019, overnight repo rates spiked above 5%, more than double their usual level, because banks’ reserves had gotten tight.
Our call
We had steady growth, a strong labor market, low inflation, an inverted yield curve, slowing growth abroad, and stress in funding markets. We recommended three things:
- Cut the federal funds target by a quarter point.
- Lower the interest rate paid on excess reserves.
- Keep supplying liquidity to the repo market. Our proposal was a 24-hour open market operations desk at the New York Fed.
On October 30, the FOMC cut the target range by a quarter point to 1.50–1.75% and lowered the rate on excess reserves along with it. It had already begun buying Treasury bills and running regular repo operations to add reserves, though not through a 24-hour desk. Two out of three isn’t bad.
Calling the cut was the easy part, since markets were pricing it in heavily by late October.